
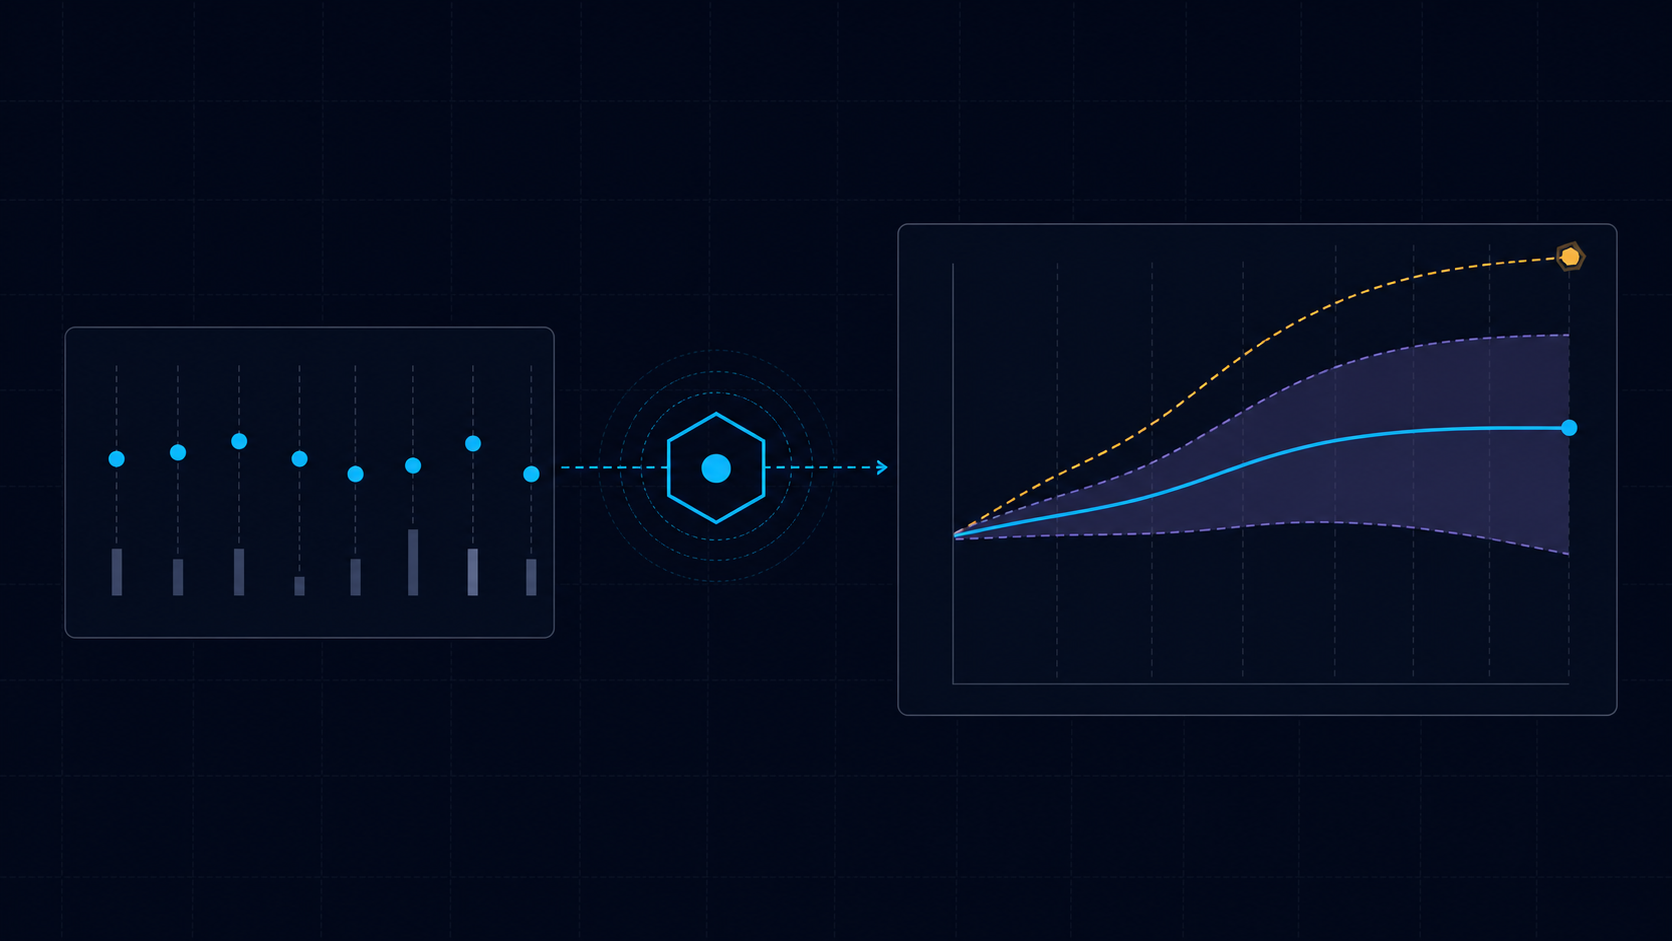
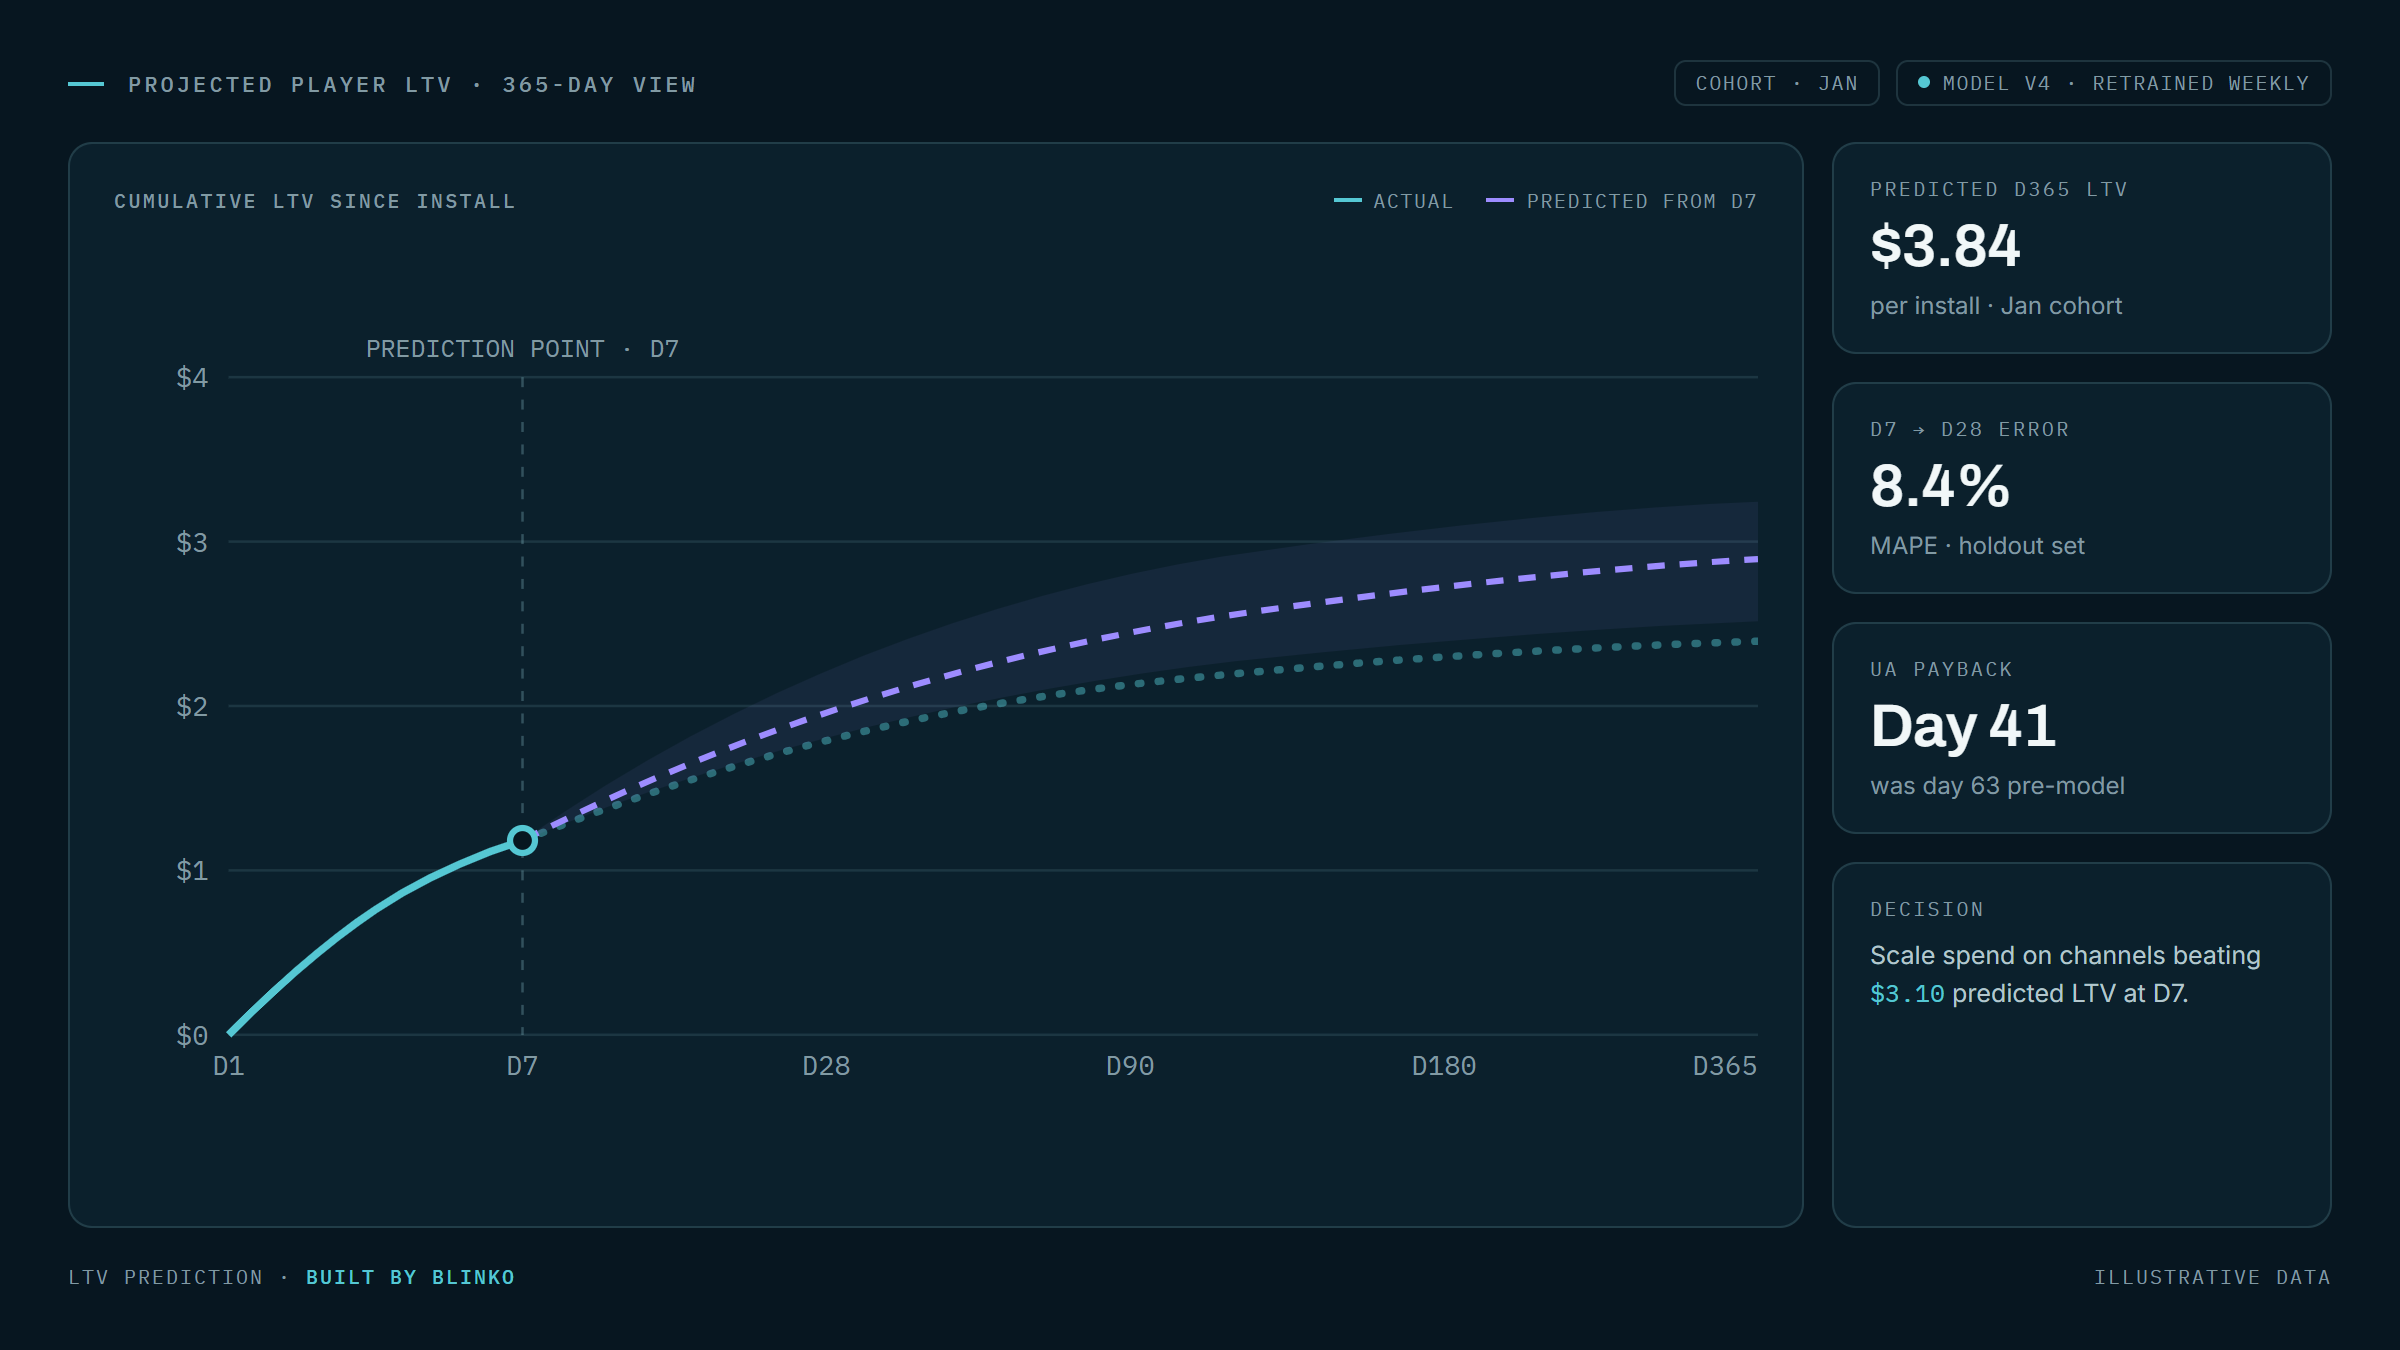
In mobile gaming, 28 days is a long time. A user-acquisition team cannot always wait four weeks to know whether a campaign is worth scaling. Creative tests, bids, geographies, and budget allocation decisions often need to happen while the campaign is still alive. That is why many studios want a model that can look at a player's first week and estimate their value by day 28.
On paper, the request sounds simple: use D0–D7 data to predict D28 revenue. In practice, a good LTV system becomes much more than a model. It becomes a way to understand how value is created inside the game economy. It forces the team to answer four questions: Which metric should define success? Which early signals actually matter? How should we treat whales? And can one game teach another?
The observations below come from an anonymized mobile game analytics engagement across casual and puzzle titles. All client identifiers, campaign names, exact data volumes, and commercially sensitive figures have been removed or generalized. The lessons, however, are broadly useful for game founders, UA leaders, product analysts, and data teams building LTV prediction systems.
Lesson 1: MAPE Can Punish the Wrong Mistakes
The most common early confusion in LTV projects is metric selection. Many teams instinctively ask for MAPE — mean absolute percentage error. It sounds intuitive: if the model predicts $0.80 and the player eventually generates $1.00, the error is 20%. Easy.
But mobile game revenue is not normally distributed. Most players generate zero or near-zero revenue, while a small minority generates most of the dollars. In that world, MAPE can become mathematically loud but commercially quiet. A two-cent error on a player worth one cent can look like a catastrophic percentage miss. A multi-dollar error on a high-value player can look less dramatic in percentage terms — even though it matters far more to ROAS.
A useful way to explain this to executives: MAPE screams at pennies and whispers at dollars.
That does not make MAPE useless. It means MAPE should be used carefully, often only above a revenue threshold, and rarely as the only headline metric.
For mobile game LTV, WAPE is often a better primary metric. WAPE asks: out of the total revenue dollars in this cohort, what fraction did the model misallocate? This aligns more closely with UA economics because acquisition decisions are usually made at the cohort, campaign, source, or country level — not from one isolated user prediction.
| Metric | What it tells you | Best use | Main trap |
|---|---|---|---|
| MAPE | Average percentage error per user | Diagnostic only; use with revenue thresholds | Can exaggerate tiny-dollar mistakes |
| WAPE | Total error divided by total actual revenue | Primary metric for UA economics | Can hide poor ranking if used alone |
| MAE | Average dollar error per user | Executive communication and segment diagnostics | Low-value users can dominate the average |
| Precision / Recall | Quality of high-value user detection | Whale targeting, bidding, CRM, monetization | Needs a clear threshold and operating point |
| Cohort Error | Error at campaign, week, country, or source level | Budget and ROAS decisions | Can look good while individual users are misranked |
Lesson 2: D7 Revenue Is Useful, but Behavior Explains the Future
 )
)
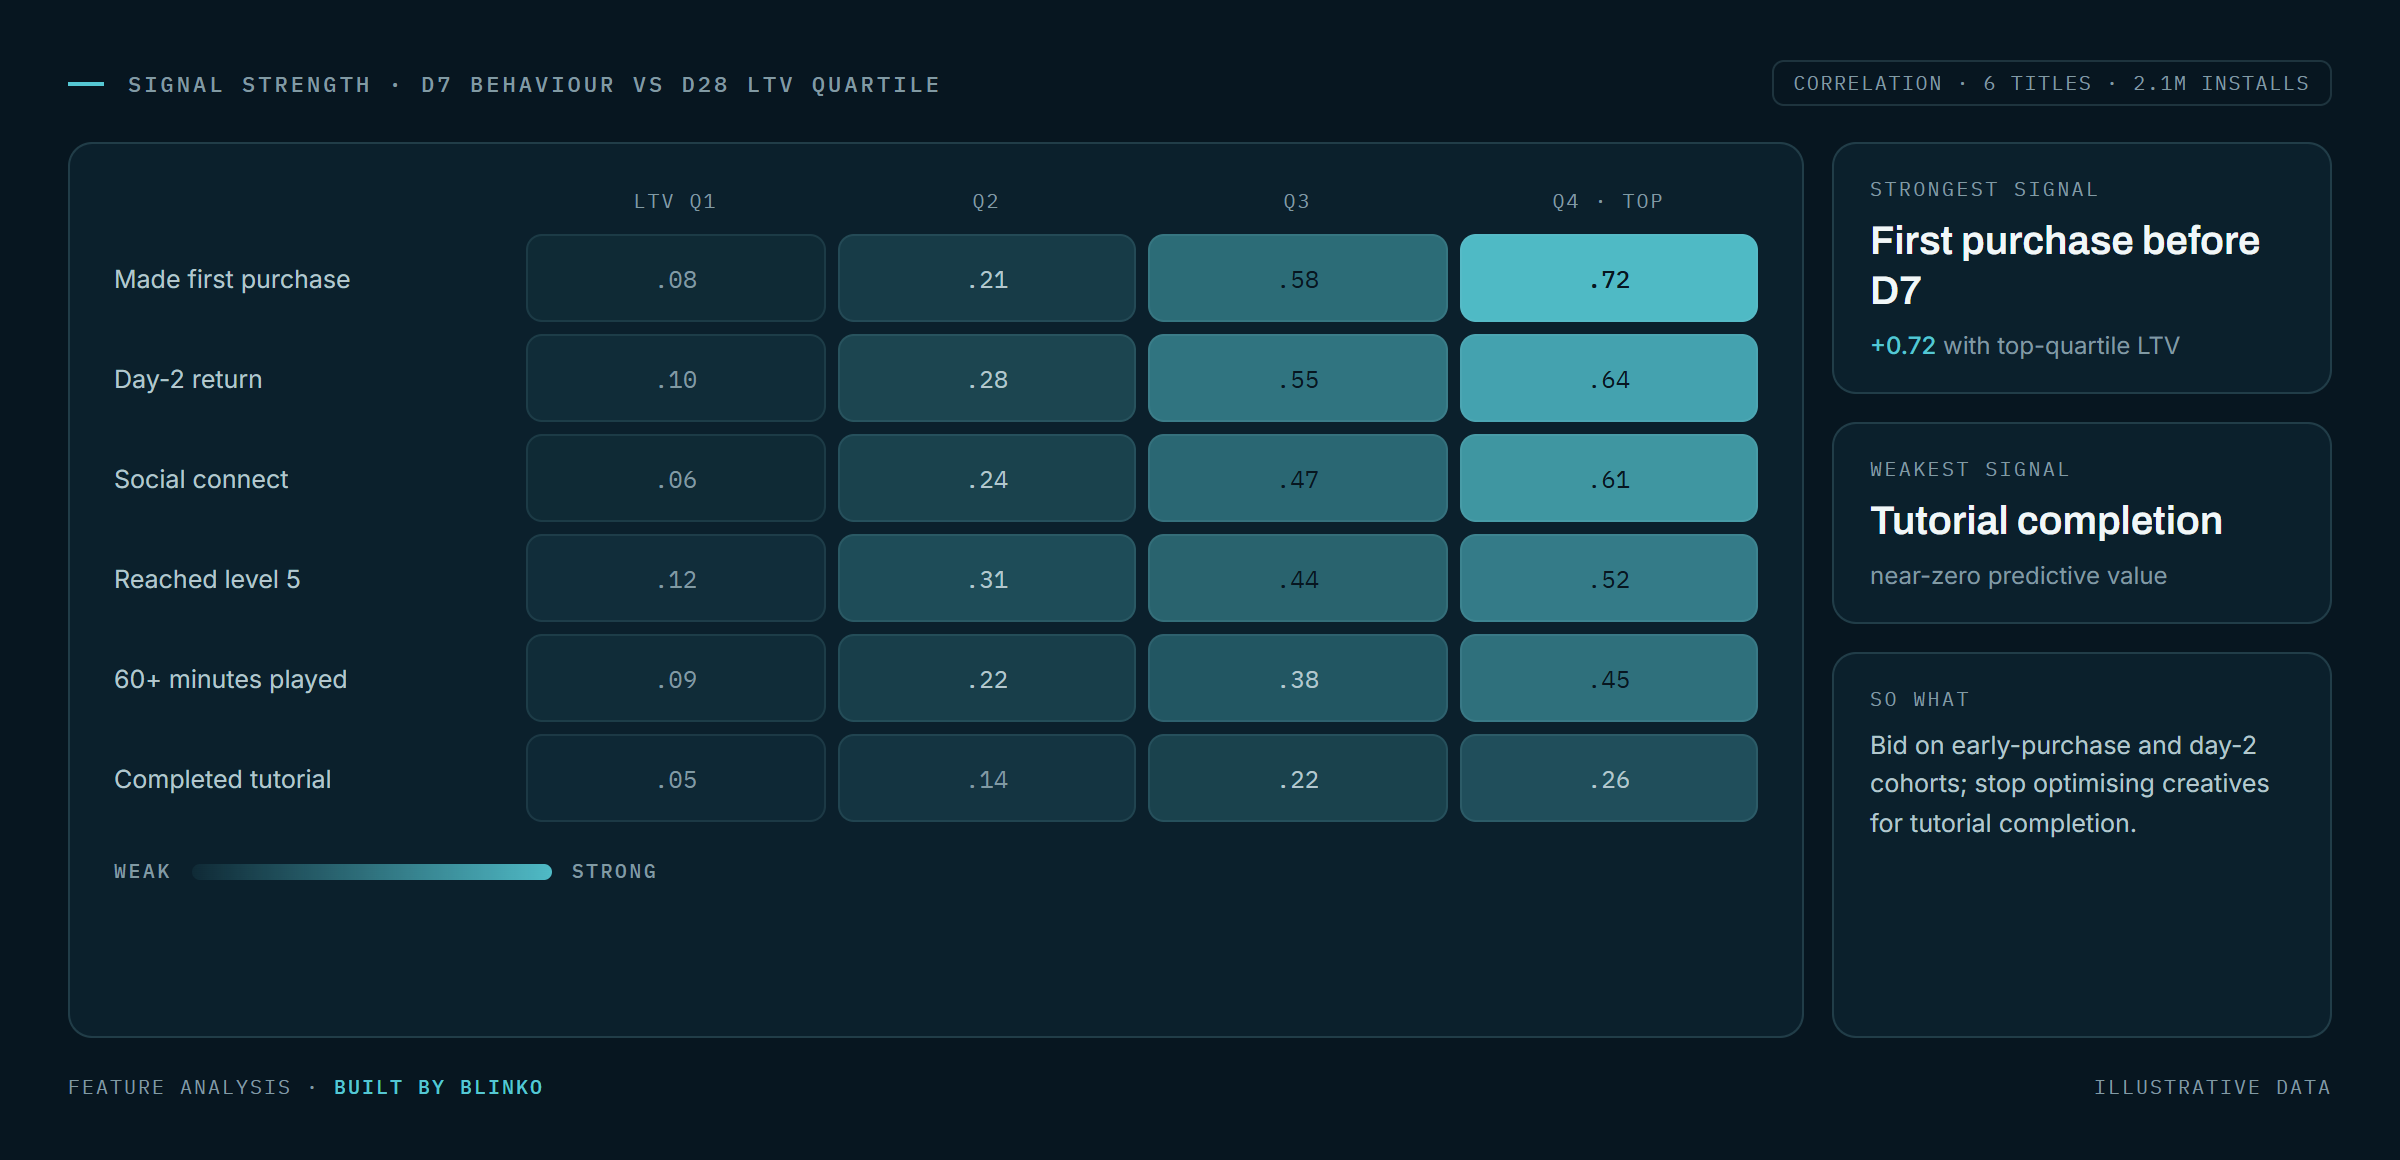
A player's first-week revenue is obviously valuable. If someone has already generated revenue by day 7, that is a strong signal. But revenue alone is a snapshot. It tells you what has happened; it does not always tell you whether the player is accelerating, decaying, or preparing to become valuable later.
In practice, strong D7-to-D28 models rely on a stack of signals:
- Revenue trajectory — is revenue rising or falling from mid-week to day 7? - Retention — is the player still active on day 6 or day 7? - Progression — are they moving through levels or stuck? - Session depth — are they casually opening the game, or showing the repeated engagement of an invested player? - Ad behavior — are impressions increasing, stable, or collapsing? - Market context — two players with the same engagement can generate different revenue if they are in different ad markets.
One particularly useful category is the game client's own cumulative monetization signal over the first week, provided it is audited carefully for leakage. If it genuinely reflects only observable D0–D7 activity, it can capture revenue dynamics not always fully reflected in server-side tables or raw event counts.
The broader insight: LTV is not predicted by money alone. It is predicted by motion — revenue moving, player activity continuing, progression deepening, ad exposure changing, and the player remaining alive in the economy after the novelty of install day fades.
| Signal family | Examples | Business question |
|---|---|---|
| Revenue motion | D7 revenue, revenue velocity, revenue acceleration/decay | Is value continuing or fading? |
| Retention | Active on late D7 days, distinct active days, last active day | Is the player still alive in the economy? |
| Gameplay depth | Max level, sessions, attempts, failures, replay behavior | Is the player invested or just sampling? |
| Ad behavior | Impressions, rewarded ads, interstitial exposure, ad revenue rhythm | Is monetization opportunity expanding? |
| Market context | Country, eCPM, source, adgroup/creative context | What is each engagement unit worth? |
| Portfolio context | Comparable games, genre-level patterns, campaign families | Can a mature title teach a newer one? |
Lesson 3: Whale Prediction Is a Different Problem from Average Prediction
The biggest mistake in many game analytics projects is treating all users as if they belong to one smooth distribution. They do not. In most free-to-play economies, a small group of high-value users carries a disproportionate share of revenue. These players are not just "slightly higher than average" — they are the business model.
A single global regressor trained on all users has a natural bias: because most users are low-value, the model is rewarded for predicting small values most of the time. That can produce acceptable global error while underestimating the very users who matter most. For UA teams, missing high-value users can be more expensive than being slightly wrong on thousands of low-value users.
A more practical architecture is often two-stage:
- Use a classifier to rank users by their probability of becoming high-value.
- Route the top-ranked users into a specialist regressor that estimates how much those likely whales may be worth.
- Keep a separate full-cohort model for aggregate ROAS reporting.
Whale models should be evaluated with precision, recall, and dollars captured — not just average error. Recall tells you whether you caught the whales. Precision tells you whether the flagged users are genuinely valuable or mostly noise. In UA, a false positive that is still a decent payer may be operationally acceptable; a false negative on a future whale can be much more expensive.
Lesson 4: One Game Is a Dataset; a Portfolio Is an Advantage
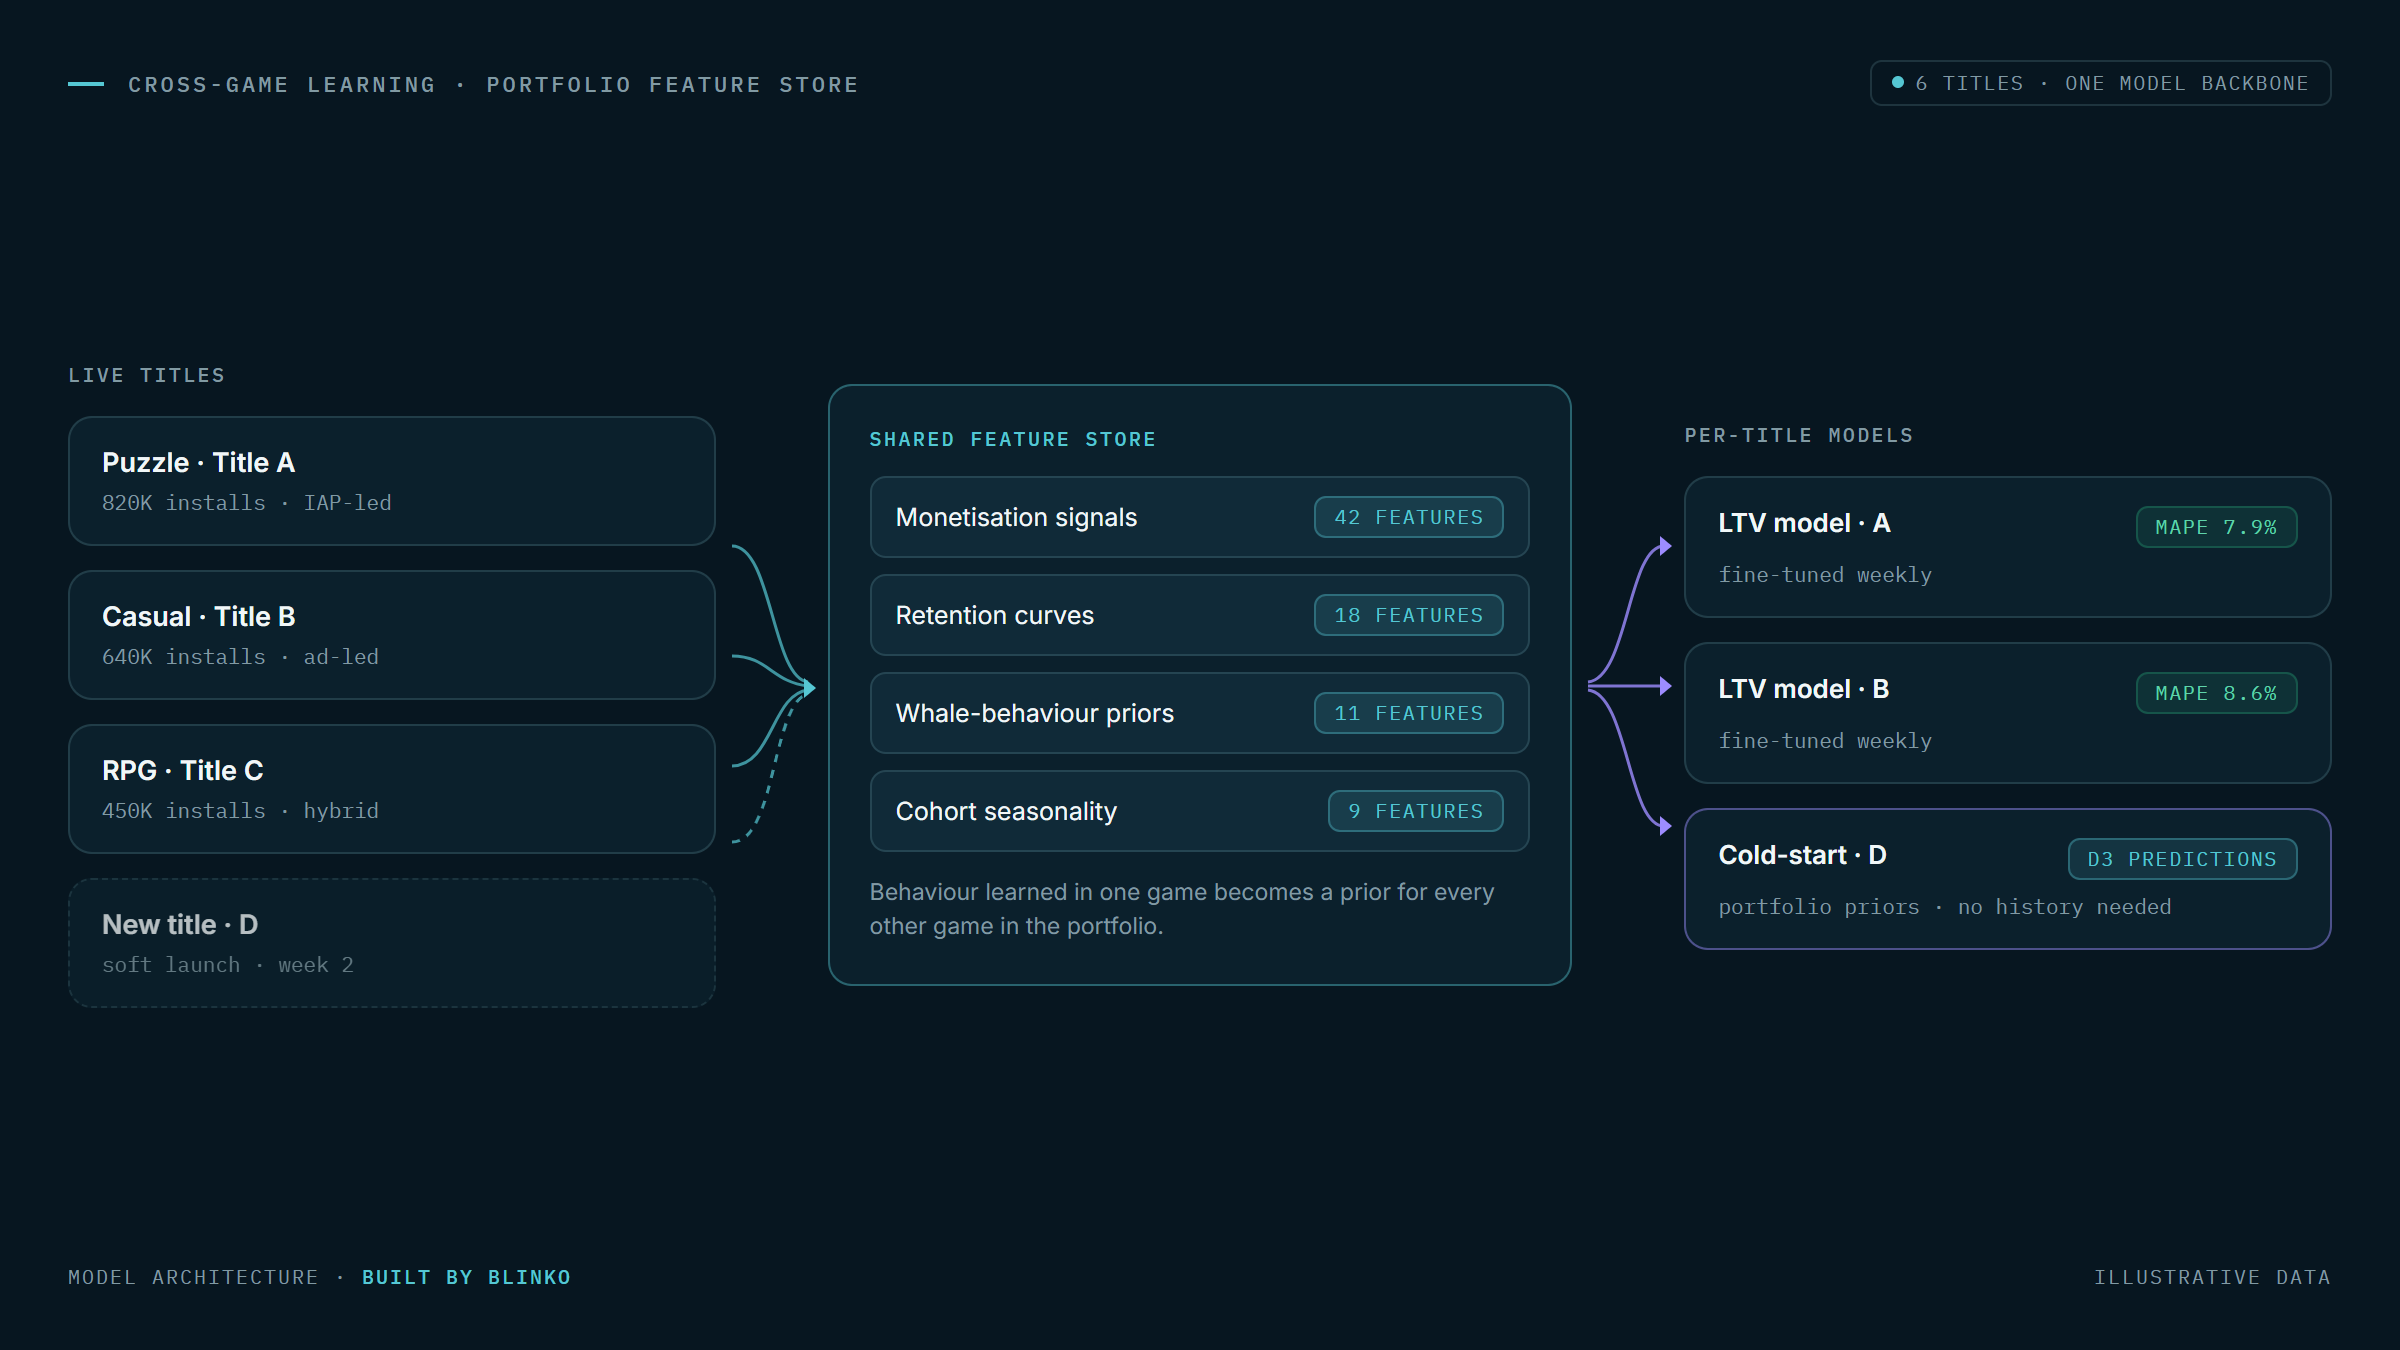
A single game may not generate enough examples of rare high-value behavior to train a stable model. This is especially true for new titles, new campaigns, new geographies, or games where whales are rare but commercially important. A portfolio of games changes the equation.
Cross-game learning does not mean blindly training one universal model and applying it everywhere. The games still differ — progression systems, ad placements, level difficulty, economy design, payer mix, and market distribution all matter. But a portfolio can share a feature vocabulary: retention, progression depth, revenue velocity, ad engagement, economy interaction, and market context. It can also share validation discipline: temporal splits, leakage audits, cohort-level monitoring, and segment-specific evaluation.
In real projects, two games in the same broad genre can teach different lessons. One may be mature enough that a full-cohort model works well because most payer signal appears early. Another may require a whale-specific stack because the high-value tail behaves differently. The value of a portfolio approach is not that every game becomes identical — it is that every game contributes to a richer understanding of what early value looks like.
A Practical Framework for Game Studios
Before building the next LTV model, start with the decision, not the algorithm. A model used to size bids for high-value users should not be judged the same way as a model used for weekly campaign ROAS reporting. The metric, target, features, validation, and deployment design must follow the decision.
A strong operating checklist:
- Define the decision — budget allocation, bid sizing, creative testing, cohort ROAS, or high-value user targeting.
- Define the target and observation window — what exactly is D28 revenue, and which users have a complete post-install window?
- Choose the metric stack — WAPE for dollars, MAE for communication, thresholded MAPE for diagnostics, precision/recall for whales, cohort error for UA reporting.
- Build the signal map — revenue trajectory, retention, progression, sessions, ad impressions, in-game economy, market context, and attribution.
- Prevent leakage — every feature must be available at scoring time. If a cumulative revenue signal is used, audit the time boundary carefully.
- Segment by value — evaluate all users, payers, whales, and super-whales separately. A single global score can hide the problem.
- Compare architectures — full-cohort regression, two-stage whale systems, and portfolio or cross-game variants.
- Validate like production — train on the past, test on the future, and monitor cohort drift.
- Deploy as a loop — score new D7 users, compare predictions with actual D28 outcomes later, retrain, and feed results into UA dashboards.
The Lesson That Gets Missed
Mobile game LTV prediction is not a Kaggle problem. It is an operating system for faster decision-making.
The best teams will not ask only, "What is the model error?" They will ask: Did we choose the right metric? Did we capture behavior, not just revenue? Did we treat whales as a separate economic segment? Can our games learn from each other? And can this prediction loop improve every month as more data arrives?
When the answer is yes, D7-to-D28 prediction stops being a report. It becomes a strategic advantage for user acquisition, monetization, and portfolio growth.
If your UA team is waiting 28 days to learn campaign quality, your feedback loop may be too slow. A D7 LTV system can turn early behavior into faster, smarter portfolio decisions.
Written by

Want this applied to your data?
In a free 30-minute call we will map the systems involved and suggest the smallest useful first step. No pitch and no obligation.